Edge Refinement on Spherical Surfaces#
This notebook demonstrates how to refine edges on a sphere, showing the difference between linear interpolation and spherical (geodesic) interpolation.
Import Libraries#
[1]:
import matplotlib.pyplot as plt
from matplotlib.patches import Arc
import numpy as np
from matplotlib import collections as mc
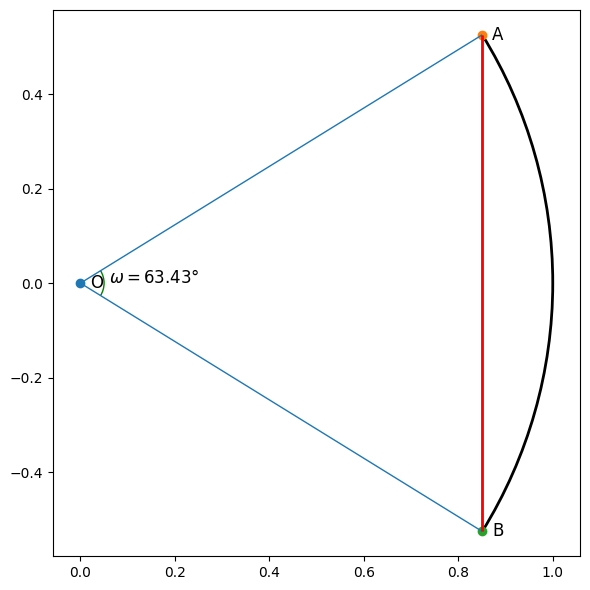
Setup: Define Points on Icosahedron Edge#
We start with two vertices from an icosahedron on a unit sphere.
[2]:
phi = (1 + 5**0.5) / 2
length = 2 / (1 + phi**2)**0.5
print(f"Base edge length: {length:.4f}")
Base edge length: 1.0515
Visualize the Initial Edge#
[4]:
phi = (1 + 5**0.5) / 2
p_O = np.array([0, 0.0])
p_A = np.array([phi, 1])
p_B = np.array([phi, -1])

# Normalize to unit sphere
p_A = p_A / (1 + phi**2) ** 0.5
p_B = p_B / (1 + phi**2) ** 0.5

A_theta = np.arcsin(p_A[1]) / np.pi * 180
B_theta = np.arcsin(p_B[1]) / np.pi * 180
omega = np.arccos(np.dot(p_A, p_B))

arc_AB= Arc(
    (0, 0),
    2,
    2,
    theta1=B_theta,
    theta2=A_theta,
    linewidth=2,
    zorder=0,
    color="k",
)

print(f"||AB|| = {np.linalg.norm(p_A - p_B):.4f}")
print(f"Angle between A and B: {omega / np.pi * 180:.2f}°")
||AB|| = 1.0515
Angle between A and B: 63.43°
[6]:
# Create figure
plt.figure(figsize=(6, 6))


ax = plt.gca()

# Plot points
for p, lab in [(p_O, "O"), (p_A, "A"), (p_B, "B")]:
    ax.scatter(*p)
    ax.annotate(
        lab, p, fontsize=12, xytext=(10, -5), textcoords="offset pixels"
    )

ax.add_patch(arc_AB)

ax.add_patch(
    Arc(
        (0, 0),
        0.1,
        0.1,
        theta1=B_theta,
        theta2=A_theta,
        linewidth=1,
        zorder=0,
        color="g",
    )
)
ax.annotate(rf"$\omega={omega / np.pi * 180:.2f}°$", (0.06, 0.0), fontsize=12)

# Add lines
ax.add_collection(
    mc.LineCollection([[p_O, p_A], [p_O, p_B], [p_A, p_B]], linewidths=1)
)
ax.add_collection(mc.LineCollection([[p_A, p_B]], colors="r", linewidths=2))
plt.axis("equal")
plt.tight_layout()
plt.show()
Helper Function for Distance Annotation#
[18]:
def annotate_distances(ax, points, offset=None):
    """Annotate distances between consecutive points."""
    offset = offset or [0, 0]
    dists = np.linalg.norm(points[1:] - points[:-1], axis=-1)
    for i in range(points.shape[0] - 1):
        p = (points[i] + points[i + 1]) / 2
        ax.annotate(rf"$={dists[i]:.2f}$", p + offset, fontsize=10)
Linear Interpolation (Incorrect for Spheres)#
This approach uses linear interpolation in 3D space, then projects back to the sphere. Notice the unequal edge lengths.
[19]:
alphas = np.arange(1, 5) / 5
hat_AB = p_B[None, :] * alphas[:, None] + p_A[None, :] * (1 - alphas)[:, None]
AB = hat_AB / np.linalg.norm(hat_AB, axis=-1, keepdims=True)
new_points = np.r_[p_A[None, :], AB, p_B[None, :]]
hat_new_points = np.r_[p_A[None, :], hat_AB, p_B[None, :]]
[ ]:
plt.figure(figsize=(6, 6))
ax = plt.gca()

arc_element = Arc(
    (0, 0),
    2,
    2,
    theta1=B_theta,
    theta2=A_theta,
    linewidth=1,
    zorder=0,
    color="k",
)

ax.add_patch(arc_element)
ax.add_collection(
    mc.LineCollection(
        [[p_O, p_A], [p_O, p_B], [p_A, p_B]]
        + [[p_O, AB_i] for AB_i in AB],
        linewidths=1,
    )
)
ax.add_collection(
    mc.LineCollection([[p_A, p_B]], colors="r", linewidths=2)
)

# Plot original points
for p, lab in [(p_O, "O"), (p_A, "A"), (p_B, "B")]:
    ax.scatter(*p)
    ax.annotate(
        lab, p, fontsize=10, xytext=(-25, 0), textcoords="offset pixels"
    )

# Plot linear interpolation points
for p, lab in zip(hat_AB, [rf"$\hat{{AB}}_{i}$" for i in range(1, 5)]):
    ax.scatter(*p)
    ax.annotate(
        lab, p, fontsize=10, xytext=(-30, 15), textcoords="offset pixels"
    )

# Plot projected points
for p, lab in zip(AB, [rf"${{AB}}_{i}$" for i in range(1, 5)]):
    ax.scatter(*p)
    ax.annotate(
        lab, p, fontsize=10, xytext=(10, 15), textcoords="offset pixels"
    )


annotate_distances(ax, new_points)
annotate_distances(ax, hat_new_points, offset=[-0.08, 0])


for i in range(new_points.shape[0] - 1):
    ax.add_collection(
        mc.LineCollection(
            [[new_points[i], new_points[i + 1]]], colors="g", linewidths=2
        )
    )

plt.xlim(-0.05, 1.1)
plt.axis("equal")
plt.axis("off")
plt.tight_layout()
plt.show()
---------------------------------------------------------------------------
RuntimeError                              Traceback (most recent call last)
Cell In[20], line 4
      1 plt.figure(figsize=(6, 6))
      2 ax = plt.gca()
----> 4 ax.add_patch(arc_element)
      5 ax.add_collection(
      6     mc.LineCollection(
      7         [[p_O, p_A], [p_O, p_B], [p_A, p_B]]
   (...)
     10     )
     11 )
     12 ax.add_collection(
     13     mc.LineCollection([[p_A, p_B]], colors="r", linewidths=2)
     14 )

File /misc/envs/sphedron/lib/python3.10/site-packages/matplotlib/axes/_base.py:2473, in _AxesBase.add_patch(self, p)
   2469 """
   2470 Add a `.Patch` to the Axes; return the patch.
   2471 """
   2472 _api.check_isinstance(mpatches.Patch, p=p)
-> 2473 self._set_artist_props(p)
   2474 if p.get_clip_path() is None:
   2475     p.set_clip_path(self.patch)

File /misc/envs/sphedron/lib/python3.10/site-packages/matplotlib/axes/_base.py:1226, in _AxesBase._set_artist_props(self, a)
   1224 def _set_artist_props(self, a):
   1225     """Set the boilerplate props for artists added to Axes."""
-> 1226     a.set_figure(self.get_figure(root=False))
   1227     if not a.is_transform_set():
   1228         a.set_transform(self.transData)

File /misc/envs/sphedron/lib/python3.10/site-packages/matplotlib/artist.py:755, in Artist.set_figure(self, fig)
    749 # if we currently have a figure (the case of both `self.figure`
    750 # and *fig* being none is taken care of above) we then user is
    751 # trying to change the figure an artist is associated with which
    752 # is not allowed for the same reason as adding the same instance
    753 # to more than one Axes
    754 if self._parent_figure is not None:
--> 755     raise RuntimeError("Can not put single artist in "
    756                        "more than one figure")
    757 self._parent_figure = fig
    758 if self._parent_figure and self._parent_figure is not self:

RuntimeError: Can not put single artist in more than one figure
Check the edge lengths (notice they are unequal):
[7]:
np.linalg.norm(new_points[1:]-new_points[:-1],axis=-1)
[7]:
array([0.19814743, 0.2315976 , 0.24534642, 0.2315976 , 0.19814743])
[ ]:
alphas = np.sin(np.arange(1, 5) / 5 * omega) / np.sin(omega)
betas = np.sin((1 - np.arange(1, 5) / 5) * omega) / np.sin(omega)
hat_AB = p_B[None, :] * alphas[:, None] + p_A[None, :] * betas[:, None]
AB = hat_AB / np.linalg.norm(hat_AB, axis=-1, keepdims=True)
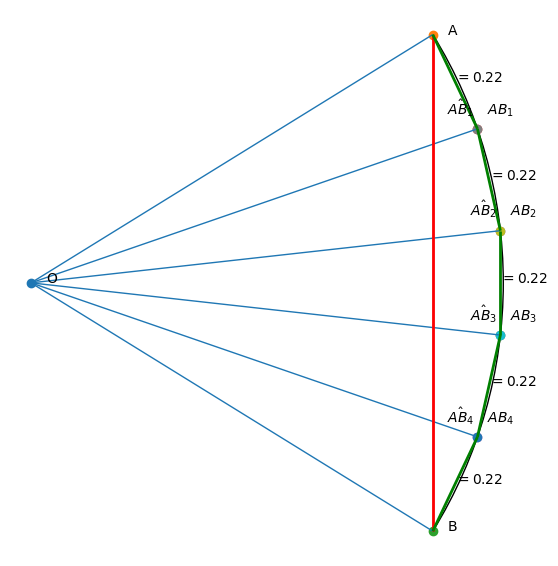
Spherical Interpolation (Correct Method)#
Using the spherical law of sines for proper geodesic interpolation on the sphere. This produces equal edge lengths.
[ ]:
plt.figure(figsize=(6, 6))
ax = plt.gca()

# Plot original points
for p, lab in [(p_O, "O"), (p_A, "A"), (p_B, "B")]:
    ax.scatter(*p)
    ax.annotate(lab, p, fontsize=10, xytext=(15, 0), textcoords='offset pixels')

# Plot intermediate points
for p, lab in zip(hat_AB, [rf"$\hat{{AB}}_{i}$" for i in range(1, 5)]):
    ax.scatter(*p)
    ax.annotate(lab, p, fontsize=10, xytext=(-30, 15), textcoords='offset pixels')

for p, lab in zip(AB, [rf"${{AB}}_{i}$" for i in range(1, 5)]):
    ax.scatter(*p)
    ax.annotate(lab, p, fontsize=10, xytext=(10, 15), textcoords='offset pixels')

arc_element = Arc((0, 0), 2, 2, theta1=B_theta, theta2=A_theta, linewidth=1, zorder=0, color="k")
ax.add_patch(arc_element)
ax.add_collection(mc.LineCollection([[p_O, p_A], [p_O, p_B], [p_A, p_B]] + [[p_O, AB_i] for AB_i in AB], linewidths=1))
ax.add_collection(mc.LineCollection([[p_A, p_B]], colors="r", linewidths=2))

new_points = np.r_[p_A[None, :], AB, p_B[None, :]]
annotate_distances(ax, new_points)

for i in range(new_points.shape[0] - 1):
    ax.add_collection(mc.LineCollection([[new_points[i], new_points[i + 1]]], colors="g", linewidths=2))

plt.xlim(-0.05, 1.1)
plt.axis('equal')
plt.tight_layout()
plt.axis("off")
plt.show()